
Leakage Rates, Detection Lag & Financial Impact Across the EOR Industry
SERIES 2 OF 5 – Highlight from PHRBO’s 2026 Industry Report on Workforce Revenue Leakage in EOR Operations
In Part 1 of this series, we established what workforce revenue leakage is, why EOR providers are uniquely exposed, and how it compounds over time. In Part 2, we turn to the numbers: how widespread is the problem, what are the leakage rates by operator size, and what does the total financial impact look like across the industry?
The findings are clear, and they are significant.
How Widespread Is the Problem?
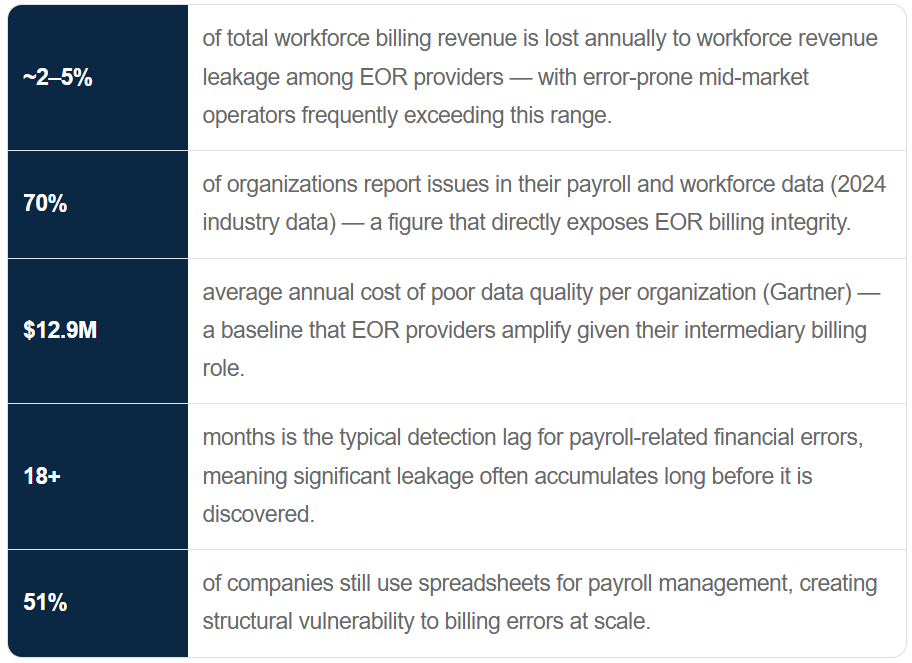
Workforce revenue leakage is not an edge case. It is a systemic feature of how most EOR providers currently operate.
- The majority of EOR providers — estimated at over 60% — experience measurable workforce revenue leakage at any given point in their billing cycle, with incidence rising sharply among providers managing more than 500 workers across multiple jurisdictions.
- Nearly 70% of organizations report issues in their payroll and workforce data (2024 industry analysis). For EOR providers, this represents a direct revenue risk rather than merely an administrative inconvenience.
- Approximately 40–50% of small and mid-market operators have no formal automated mechanism to detect workforce revenue leakage. Detection, where it occurs, is typically reactive: triggered by client disputes, end-of-quarter reconciliation discrepancies, or annual audit findings.
The majority of EOR providers experiencing leakage have no formal automated mechanism to detect it. They are losing revenue they cannot see.
Leakage Rates by Operator Size
Revenue leakage as a percentage of total workforce billing revenue varies significantly by operator size, systems maturity, and geographic complexity. Based on analysis of billing error rates, payroll data quality benchmarks, and EOR-specific operational patterns, the estimated leakage rate ranges are:
*Enterprise operators with mature systems may achieve lower leakage rates, but their absolute dollar exposure remains the highest due to volume. Many enterprise EOR providers managing 10,000+ workers across 20+ countries may experience leakage well in excess of the low-end estimate.
Note: These estimates assume an average monthly billing rate of $3,500–$4,500 per worker, consistent with mid-market EOR pricing ranges.
Which Workforce Events Generate the Most Leakage?
Not all workforce events carry equal leakage risk. Analysis of EOR billing workflows and error incidence data identifies the following ranked order of leakage-generating events:
How Long Does Leakage Go Undetected?
Detection lag is one of the most financially damaging characteristics of workforce revenue leakage. Because most EOR providers rely on reactive detection mechanisms, client disputes, quarterly reconciliations, or year-end audits, leakage can persist for extended periods before anyone identifies it.
In EOR-specific contexts, the lag is often extended further by the fact that the client company, which would notice billing discrepancies, has limited visibility into the EOR provider’s internal workforce records.
Once leakage is detected late, recovery rates are poor. Industry estimates suggest that 30–50% of leakage identified after a 6-month lag is unrecoverable, rising to 60–70% after 12 months or when the worker engagement has already concluded.
Annual Financial Impact Per EOR Operator
Translating leakage rate estimates into concrete annual financial impact provides EOR leadership with the clearest basis for investment decision-making:
At an industry-wide leakage rate of 2–5% of workforce billing revenue, the total value of workforce revenue leakage across the global EOR market in 2026 is estimated to fall between $149 million and $373 million annually.
What’s Next in This Series
Part 3 maps exactly where revenue leakage enters EOR operations, stage by stage through the worker lifecycle, from pre-onboarding setup through final offboarding settlement.
Sources: electroiq.com Payroll Statistics (2024), Employsome EOR Market Forecast (2026), Jibble.io Revenue Leakage Impact Analysis, Custom Market Insights EOR Report (2026), HireLevel Payroll Fraud Risk (2025), ACFE Occupational Fraud Report.
Be the First to Access the 2026 EOR Revenue Report
To access the 32 page report of hidden revenue leaks impacting EOR businesses, join the email distribution list and receive it in your inbox on March 30, 2026.