

Clients don’t churn because a PEO isn’t delivering value — they churn because PEOs render this value invisible. This post gives operators a repeatable framework for PEO ROI reporting that translates services into numbers a client’s leadership team actually understands, without burying them in a spreadsheet.
Why Most PEO Client Reports Get Ignored
Most PEO reporting fails for one reason: it’s built for the person who runs payroll, not the person who signs the renewal. A line-item invoice or a 40-tab dashboard export makes sense to an HR contact. It means nothing to a CFO.
Here’s the reality on the client side. The person actually reading your report usually isn’t the HR manager who fields your calls every week. It’s an owner, a CFO, or a board member who wants three numbers, not thirty. When a report doesn’t answer their question in the first ten seconds, it gets forwarded, skimmed, and forgotten before the next quarter.
Annual reviews make this worse. A once-a-year meeting that reads like compliance paperwork — workers’ comp filings, benefit renewal dates, a wall of percentages — confirms the PEO is doing its job on paper. It does nothing to make the client feel the value of the relationship.
The fix isn’t more data. Operators already have more data than any client wants to read. The fix is a PEO client reporting template built around the three or four decisions a client’s leadership actually makes: renew, expand, renegotiate, or walk.
The Three Categories Every PEO ROI Report Needs
Every strong PEO ROI report organizes around three categories: hard cost savings, risk reduction, and operational or people metrics. Skip one and the report reads incomplete to a sophisticated buyer, even if the underlying service was flawless.
Hard Cost Savings
This is the category clients expect and the easiest one to get wrong by making it too granular. Workers’ comp pooling, benefits purchasing power, payroll tax administration, and avoided compliance penalties all belong here — but they should land as one number, not four line items competing for attention.
The move that works: calculate a single “savings vs. going it alone” figure. Take what the client would pay to replicate these functions independently — a benefits broker, a payroll tax specialist, a workers’ comp program at standalone rates — and net it against PEO fees.
A simple formula box earns its place here for the client who wants to see the math:
(Savings − Fees) / Fees × 100 = ROI %
This answers the AEO-searched question directly: how is PEO ROI calculated for a client? Show the formula once, plug in real numbers from the reporting period, and move on. Don’t turn the whole report into a spreadsheet exercise.
Risk Reduction — the Invisible Line Item
Risk reduction is the category most PEOs under-report, because it doesn’t have a clean dollar figure attached. Compliance protection, audit exposure avoided, and multi-state regulatory coverage are real value even when nothing went wrong during the reporting period.
Frame this as exposure eliminated, not cost saved. A client who didn’t get hit with a misclassification penalty in Texas or a wage-and-hour audit in California isn’t seeing a number — they’re seeing an absence. That absence is the product working. Name it explicitly, or the client assumes it was never a risk to begin with.
Operational and People Metrics
Turnover impact, time-to-hire, benefits enrollment speed, and employee satisfaction signals round out the report. These metrics answer a question every retention-minded client is quietly asking: what KPIs should a PEO track for client success?
The connection to renewal is direct. Clients who see a PEO affecting outcomes beyond payroll — faster hiring, lower turnover, smoother enrollment — start viewing the relationship as strategic rather than administrative. That shift is what survives a budget review.
What to Include in a PEO Performance Metrics Report
A PEO performance metrics report works best with a fixed structure clients can learn to expect, quarter over quarter. Consistency here builds trust faster than any single impressive number.
Structure it in this order: a summary snapshot at the top of the page, cost savings detail, risk and compliance wins, people metrics, and next-quarter recommendations. Leadership readers stop at the snapshot. Operational readers keep going.
On cadence — this answers a question that comes up constantly: how often should a PEO send performance reports to clients? Quarterly works for the metrics themselves. Reserve the full ROI narrative, with formula, framing, and forward recommendations, for an annual review.
Translating Metrics Into a Client Conversation
The report is not the deliverable. The conversation about the report is the deliverable. A perfectly built PEO ROI report that gets emailed as a PDF attachment does less for retention than a mediocre report walked through in a 20-minute call.
This is the direct answer to how do I show a client their PEO is saving them money: lead the meeting with the business outcome, not the service list. Open with the renewal-relevant number — total savings, risk avoided, or a retention metric — before walking through how the PEO delivered it.
This is where PEO client retention reporting and PEO client communication best practices connect. The report gives you the numbers. The conversation is where a client decides those numbers matter enough to renew.
How Better Reporting Reduces Client Churn
There’s a direct line between reporting cadence and renewal conversations, and most PEOs underestimate how direct it is. Clients rarely churn the week something goes wrong. They churn quietly, months later, when nobody showed them why the relationship was working.
Call this the silent value problem: clients who don’t see ROI assume there isn’t any, regardless of actual performance behind the scenes. A PEO can be delivering strong results and still lose the account, because delivering results and demonstrating results are two different jobs.
This also answers how do I make a business case for renewing a PEO contract — the business case is the report itself, built in advance, not assembled defensively when a client starts asking questions about switching providers.
A Simple PEO ROI Reporting Checklist
- Lead with one number, not ten.
- Show risk avoided, not just cost saved.
- Separate the summary snapshot from the supporting detail.
- Schedule the conversation — don’t just send the PDF.
- Tie every metric back to a renewal-relevant decision.
- Report quarterly on metrics, annually on the full ROI narrative.
- Name the “silent value” explicitly instead of assuming clients will notice it.
Build This Report Once. Run It Every Quarter.
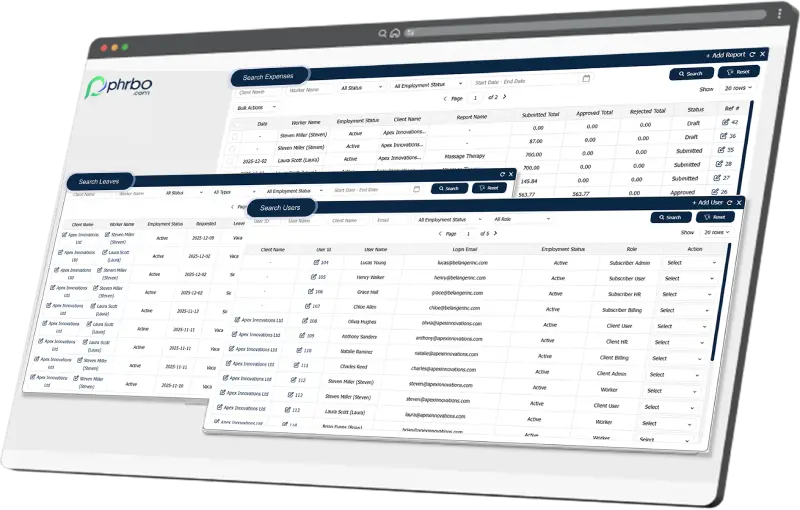
The PEOs that retain clients longest aren’t the ones with the best service — they’re the ones whose clients can see the value. PHRBO turns your operational data into the exact framework above, automatically, every reporting cycle.
The Bottom Line
Clients renew based on what they can see, not what a PEO actually delivered behind the scenes. A reporting framework built around hard costs, risk avoided, and people metrics — paired with a real conversation instead of a PDF drop — turns quiet, uncertain clients into renewals you don’t have to fight for.
